My phone began beeping repeatedly, on a cold and foggy Monday afternoon during a visit with friends in Spain over the Thanksgiving holiday a few years ago. In rapid-fire succession, I received a series of frantic text messages from a client back in the States. “No orders in the past 10 hours” one message said. Murphy’s Law — no sales during the busiest online shopping day of the year; their Shopify e-commerce store had stopped accepting orders on Cyber Monday!
As an agency that specializes in e-commerce marketing, It wasn’t the first time an e-commerce platform failed me. A few, small issues sometimes happen all at once, preventing visitors from adding things to the cart or checking out. In this scenario, like most others, I quickly resolved the problem by adjusting a couple of settings.
But this situation put me over the edge. Frustrated, I began looking for a solution that would alert me when something was wrong with a client’s store. Things will undoubtedly fail in the future, I figured. But, I needed to prevent future issues from causing lost store revenue and I wanted to be the first to know when a client’s store was having issues.
After the cyber-Monday incident, we implemented a monitoring system using Databox. As part of the solution, Databox continuously monitors key metrics and alerts us when they are outside of the normal ranges. By setting up mobile and email alerts, we discover small problems before they become big ones.
The beauty of a marketing reporting dashboard
The alerts have saved me a few times since that fateful Thanksgiving. I am forever thankful for the alert system.
I love Databox alerts. But, I really love the dashboards.
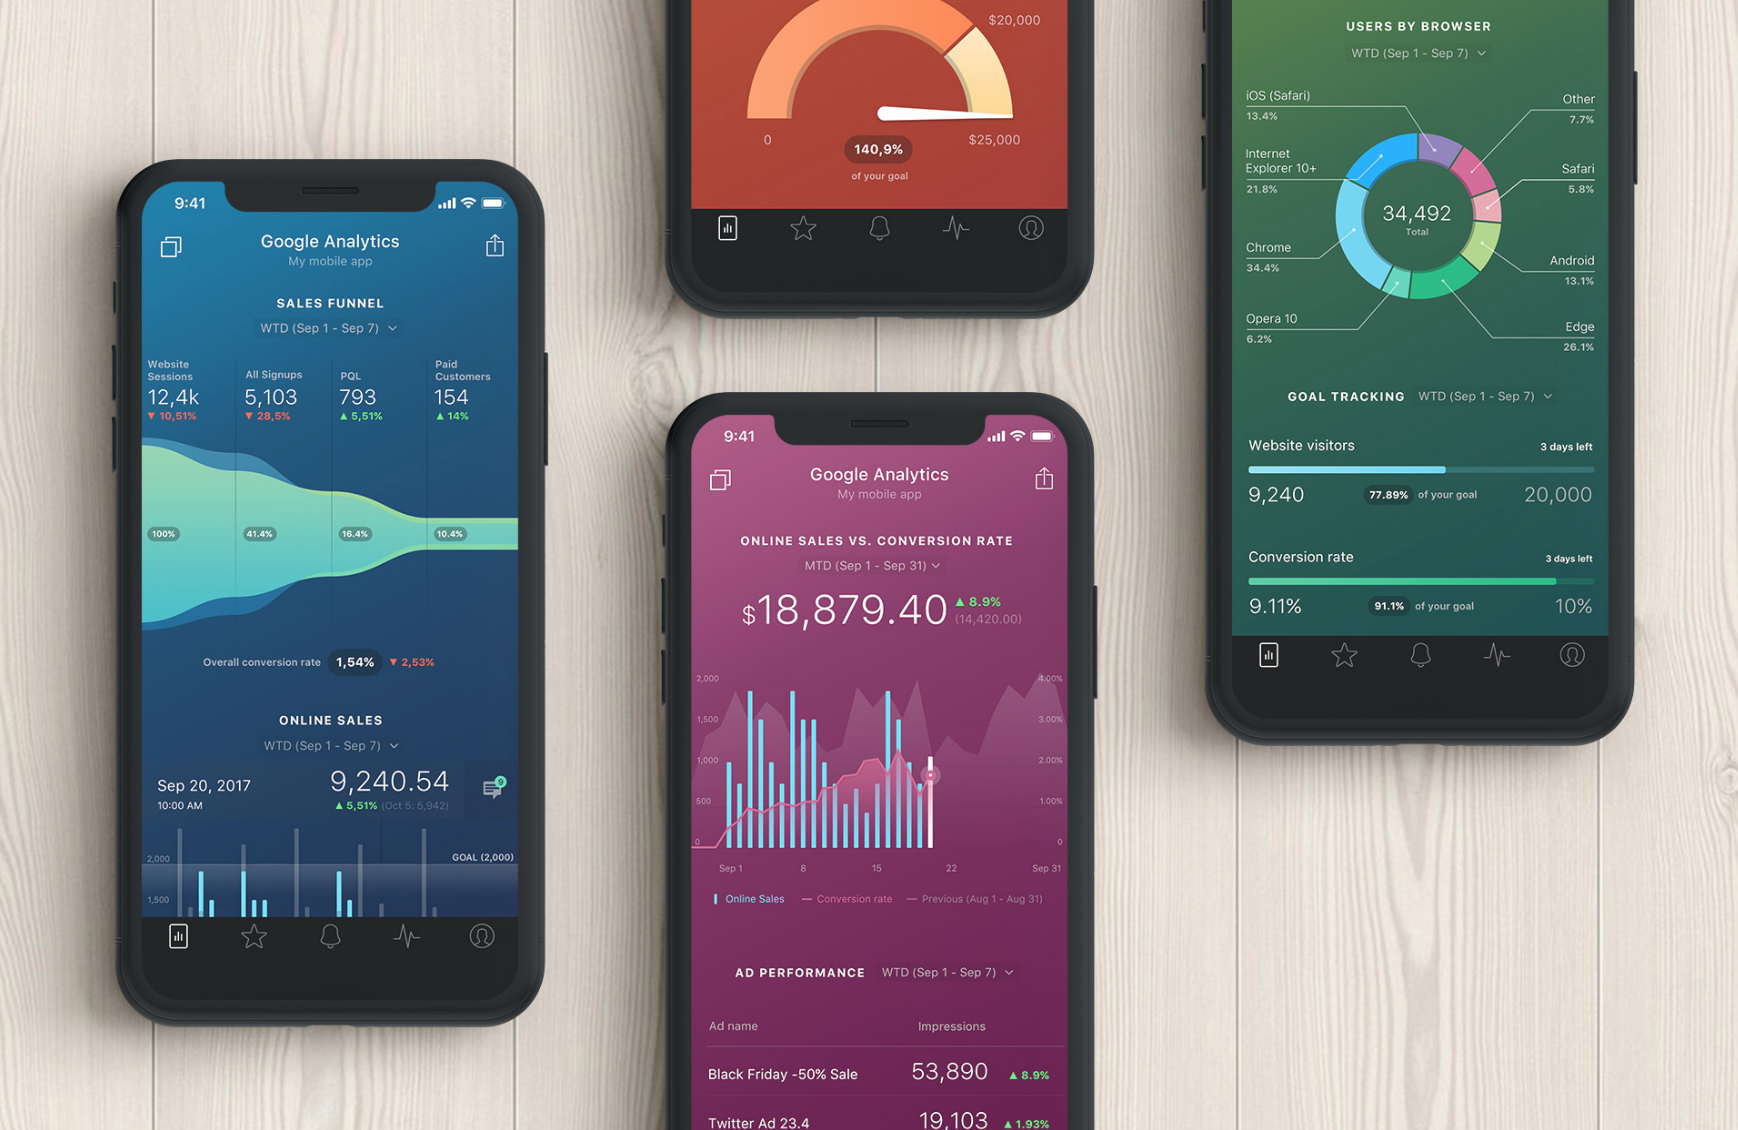
My clients and I love the powerful and beautiful reports we can access anytime, via the Databox mobile app and web dashboard.
For each client, I’ve created a high-level dashboard with 8 key metrics or Datablocks, as Databox calls them. Databox makes it easy to build dashboards by providing a set of out-of-the box widgets for Shopify store owners who also have a Google Analytics account. It also allows us to run custom queries to pull in more advanced views of the data from Google Analytics.
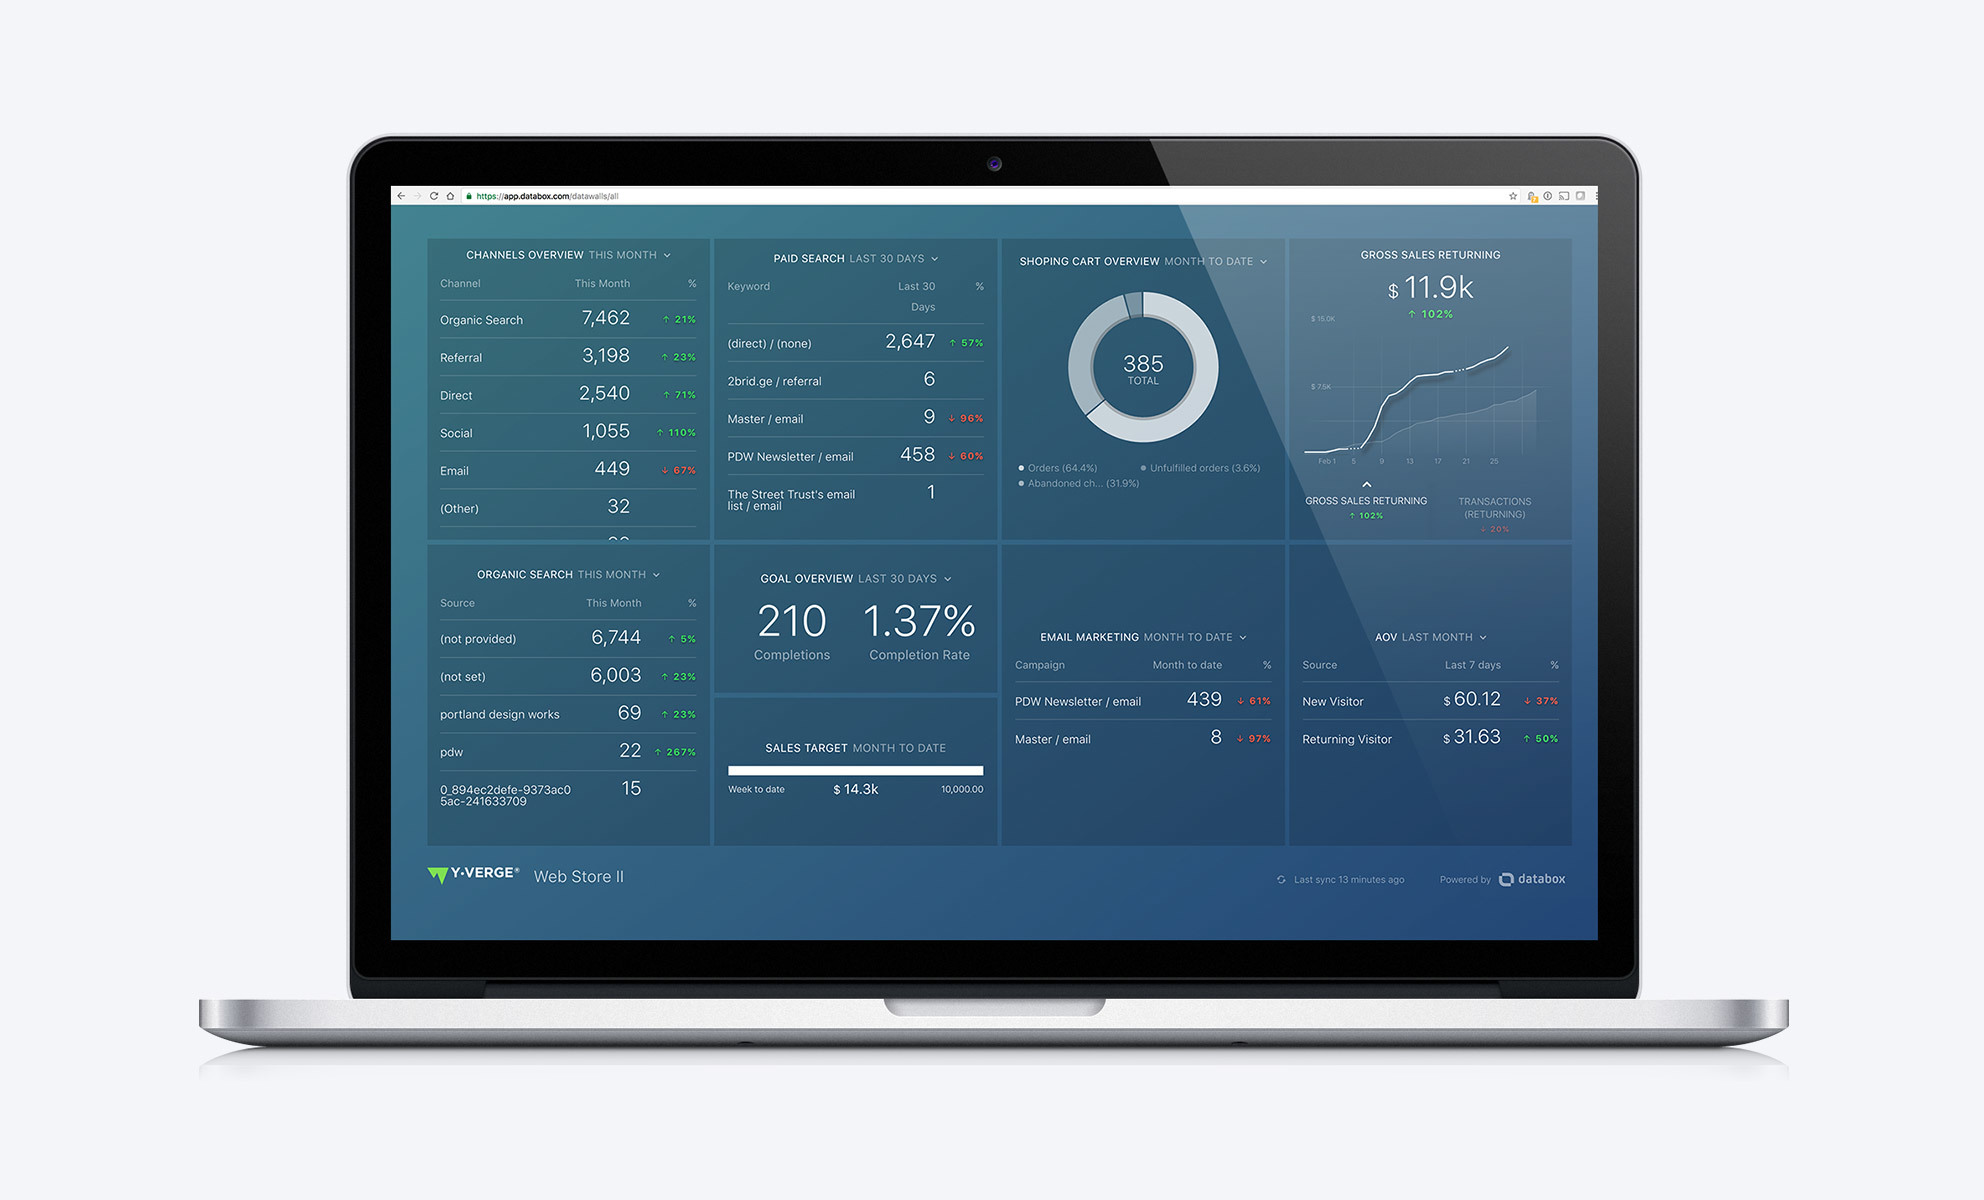
With the dashboard (shown below), my clients see exactly the store information they need, without wading through mountains of less-critical analytics data. It helps us spot problems quickly, and see what’s working well too.
In the past, I was the villain when sales blipped to zero. Now, I am a superhero with the Databox alert system and dashboards, as sales steadily climb.
What is a data dashboard?
Now I would like to back up for a minute for anybody who might be wondering, Leon, what is a data dashboard? If you are well acquainted with the basics feel free to skip to the next section but if you are learning or want a refresher, this is for you.
A data dashboard is the next level after Google Analytics. Typically, digital marketing people live only in Google Analytics. If your POV is all about your website, that's fine, but nowadays we are sometimes doing email, sometimes doing social media, and your website is just one of those components. With that in mind, Google Analytics is kind of your first step with it comes to tracking KPI's and business dat. If you're ready to level up, you should create a digital dashboard.
Data dashboards can often be marketing-specific. After all, keeping track of data on how several marketing channels and strategies are performing alone is an important task. Data dashboards can also be more comprehensive, bringing in every layer and department of a company.
A digital dashboard uses a similar approach as Google Analytics but it pulls everything together from email, from the number of products on the back end, from customer service channels, the return rate, and on. You can pull information from every single channel. Google Analytics is designed for marketing only. A digital dashboard is at the enterprise, whole company level. With it, you get a better picture.
A digital dashboard helps your marketing people to know what is going on with production, and vice versa. If everybody is on the same dashboard, they can all communicate with each other.
This access to communication between departments has deeper, more mission-level benefits as well. A lot of companies run their departments as silos. In these companies, marketing only cares about bringing traffic and they don't care about anything else. Shipping only cares about delivery. Customer service doesn't know anything that marketing does, they just pick up the phone. If you run a business this way, your left hand doesn't know what your right hand is doing.
Here is an imagined scenario: An effective marketing campaign starts driving a ton of traffic to the website; customer service becomes totally backlogged and cannot even respond to customer requests in a timely manner. With a digital dashboard as a common reference point and communication tool between departments, it's possible to slow down marketing temporarily until customer service is able to catch up. Just one example.
Why Databox is the best marketing dashboard software
Simply put, Databox is the most beautiful. It has everything you need. Personally, it is my favorite. That said, Databox starts at $100, but to make the most of it you'll want to be spending $300 per momth. If you are a lean startup or for whatever reason can't or don't have the money for Databox, I have two also great and cheaper recommendations.
My second and third favorite dashboards
If you are not technical and your needs are primarily for analytics, your level-up move is to get Geckoboard or Databox, depending on how deep is your pocket. Designed for small businesses, Geckoboard is great if your company has relatively simple needs and doesn't have engineers or other techy people on staff. At just 28 bucks a month, Geckoboard is not the prettiest data dashboard but it is definitely good.
Grafana is a dashboard for AI people. Beyond analytics, when you go to the next level and bring in AI, either statistical or machine learning, Grafana is the best. There is no other dashboard that can handle AI, currently. They are a big player, used by Netflix, Facebook, and Apple. You're in a different territory when you play with Grafana.
Whatmetrics to track on a KPI dashboard to avoid disaster and grow online sales
Let’s dive into the 8 key datablocks I put on my client's dashboard and why each is important.
1. Channel Traffic Overview Report: Make sure everything is going up and to the right.
The Channel Overview datablock shows traffic by channel from Google Analytics data, as well as whether the traffic from each channel is up or down, in comparison to the month before. This gives us insight into the health of our traffic — the first key to any online store's success. No traffic means no sales, and lower traffic means lower sales.
Unfortunately, I’ve found that store owners don’t usually understand what each channel source actually means, let alone how to grow traffic from all these different sources. Many store owners have Google Analytics, but don’t know what to do with it and rarely even look at it. This datablock puts the right data front and center, so we can monitor how well our marketing activities are increasing traffic.
2. Organic Keyword Search Results: Know which keywords are bringing in visitors.
For e-commerce sites, organic search is critical. Google’s search engine result pages (SERPs) increasingly have shown more and more ads, but users still prefer to click the pages that earned their rank on merit.
Even though Google has been encrypting most organic search traffic since 2013, Google Analytics still shows overall search traffic and a few of the most common keywords people use before visiting your site.
To get a more in-depth view of search traffic, I use Ahrefs, SEMRush, Moz and/or Google Search Console. But, no matter where you’re getting the data, knowing what keywords bring visitors is gold because it reveals the shopping interests of visitors and helps validate the content and keyword strategies you have employed for your sites and blogs.
3. Google Adwords Keywords: Find the paid ads that pull in sales.
After organic search traffic, paid search is probably the most important source of new visitors and new customers for my clients’ online stores.
This datablock allows us to view which keywords are producing clicks and how the volume of clicks compares to the previous month. In a separate dashboard, we track the conversion rate of these ads. But, this allows us to make sure we’re not being outbid on important keywords.
4. Sales Goals: Set and track progress to sales targets.
“You are 21% more likely to achieve your goals by writing them down and sharing them with a friend or colleague,” according to a study by Gail Matthews.
If that’s the case, Databox was born to help you achieve your goals. Not only does the Databox goal setting feature let you set a goal for any metric over any time period, it helps you share the goal and your progress towards it with everyone involved in helping you achieve it.
As we make changes to sites and marketing in order to improve results, we can all easily monitor how close we are to hitting targets. With always-on, any-device access to targets, we can adapt our plan to ensure we hit goals.
5. Abandoned Cart: Close more customers when it counts.
To combat abandoned-cart issues, you must understand why they are happening. There are a whole host of reasons people abandon carts that can only be alleviated by making improvements to your shopping site.
But, sometimes, it’s just distraction or comparison shopping that delays a purchase. Abandoned-cart email marketing combined with discount codes is one way we have increased the number of people who return to finish their purchase.
6. Email Campaign Reports: Get your visitors to come back to finish their purchase or to purchase again.
Email marketing is critical for driving e-commerce sales in three ways.
There are a variety of ways to capture email addresses in your marketing. Once you have one, you can send educational and promotional content to them to get them back to your site.
Once someone creates an account after browsing your store, you can use their email address to get them to complete a transaction.
Once you get someone to purchase once, you can encourage repeat or additional purchases.
According to Shopify, “Email marketing is the key to e-commerce success.” So, it’s important to make sure your email marketing is working to drive traffic and sales. The datablock in our dashboard above shows the sessions (as recorded by Google Analytics) our different email campaigns produce.
7. Customer LifeTime Value: Increase purchases from repeat customers.
Sales is a numbers game. In e-commerce, the number you need to grow is Customer LifeTime Value (LTV). Using email marketing and paid re-marketing, you can drastically increase sales from existing customers.
We use this datablock to track sales from returning versus new customers. If sales from returning customers is growing, you can be sure your LTV is increasing.
8. Average Order Value: Increase how much each customer spends.
Another sure-fire way to grow revenue is to increase your average order value (AOV). Shopify enables a host of ways to do this including product recommendations, bundling of products into packages and launching a loyalty program.
We use the last datablock on the datawall above to track the AOV of new and returning visitors.
9. Stay On Top of Your E-commerce Metrics Anywhere, All The Time
With the help of Databox, we are able to stay on top of our stores. And while I started using Databox to avoid ruining my future holidays, it’s now helping us track our performance so we can improve too.
Hopefully, this article helps you realize what you need to be tracking and doing to grow e-commerce sales too. If you think a dashboard like this could help you too, connect your Shopify account to get started.